•
원본 제작자 깃허브에서 다운로드 받기
git clone https://github.com/tdiethe/flask-live-charts.git
HTML
복사
•
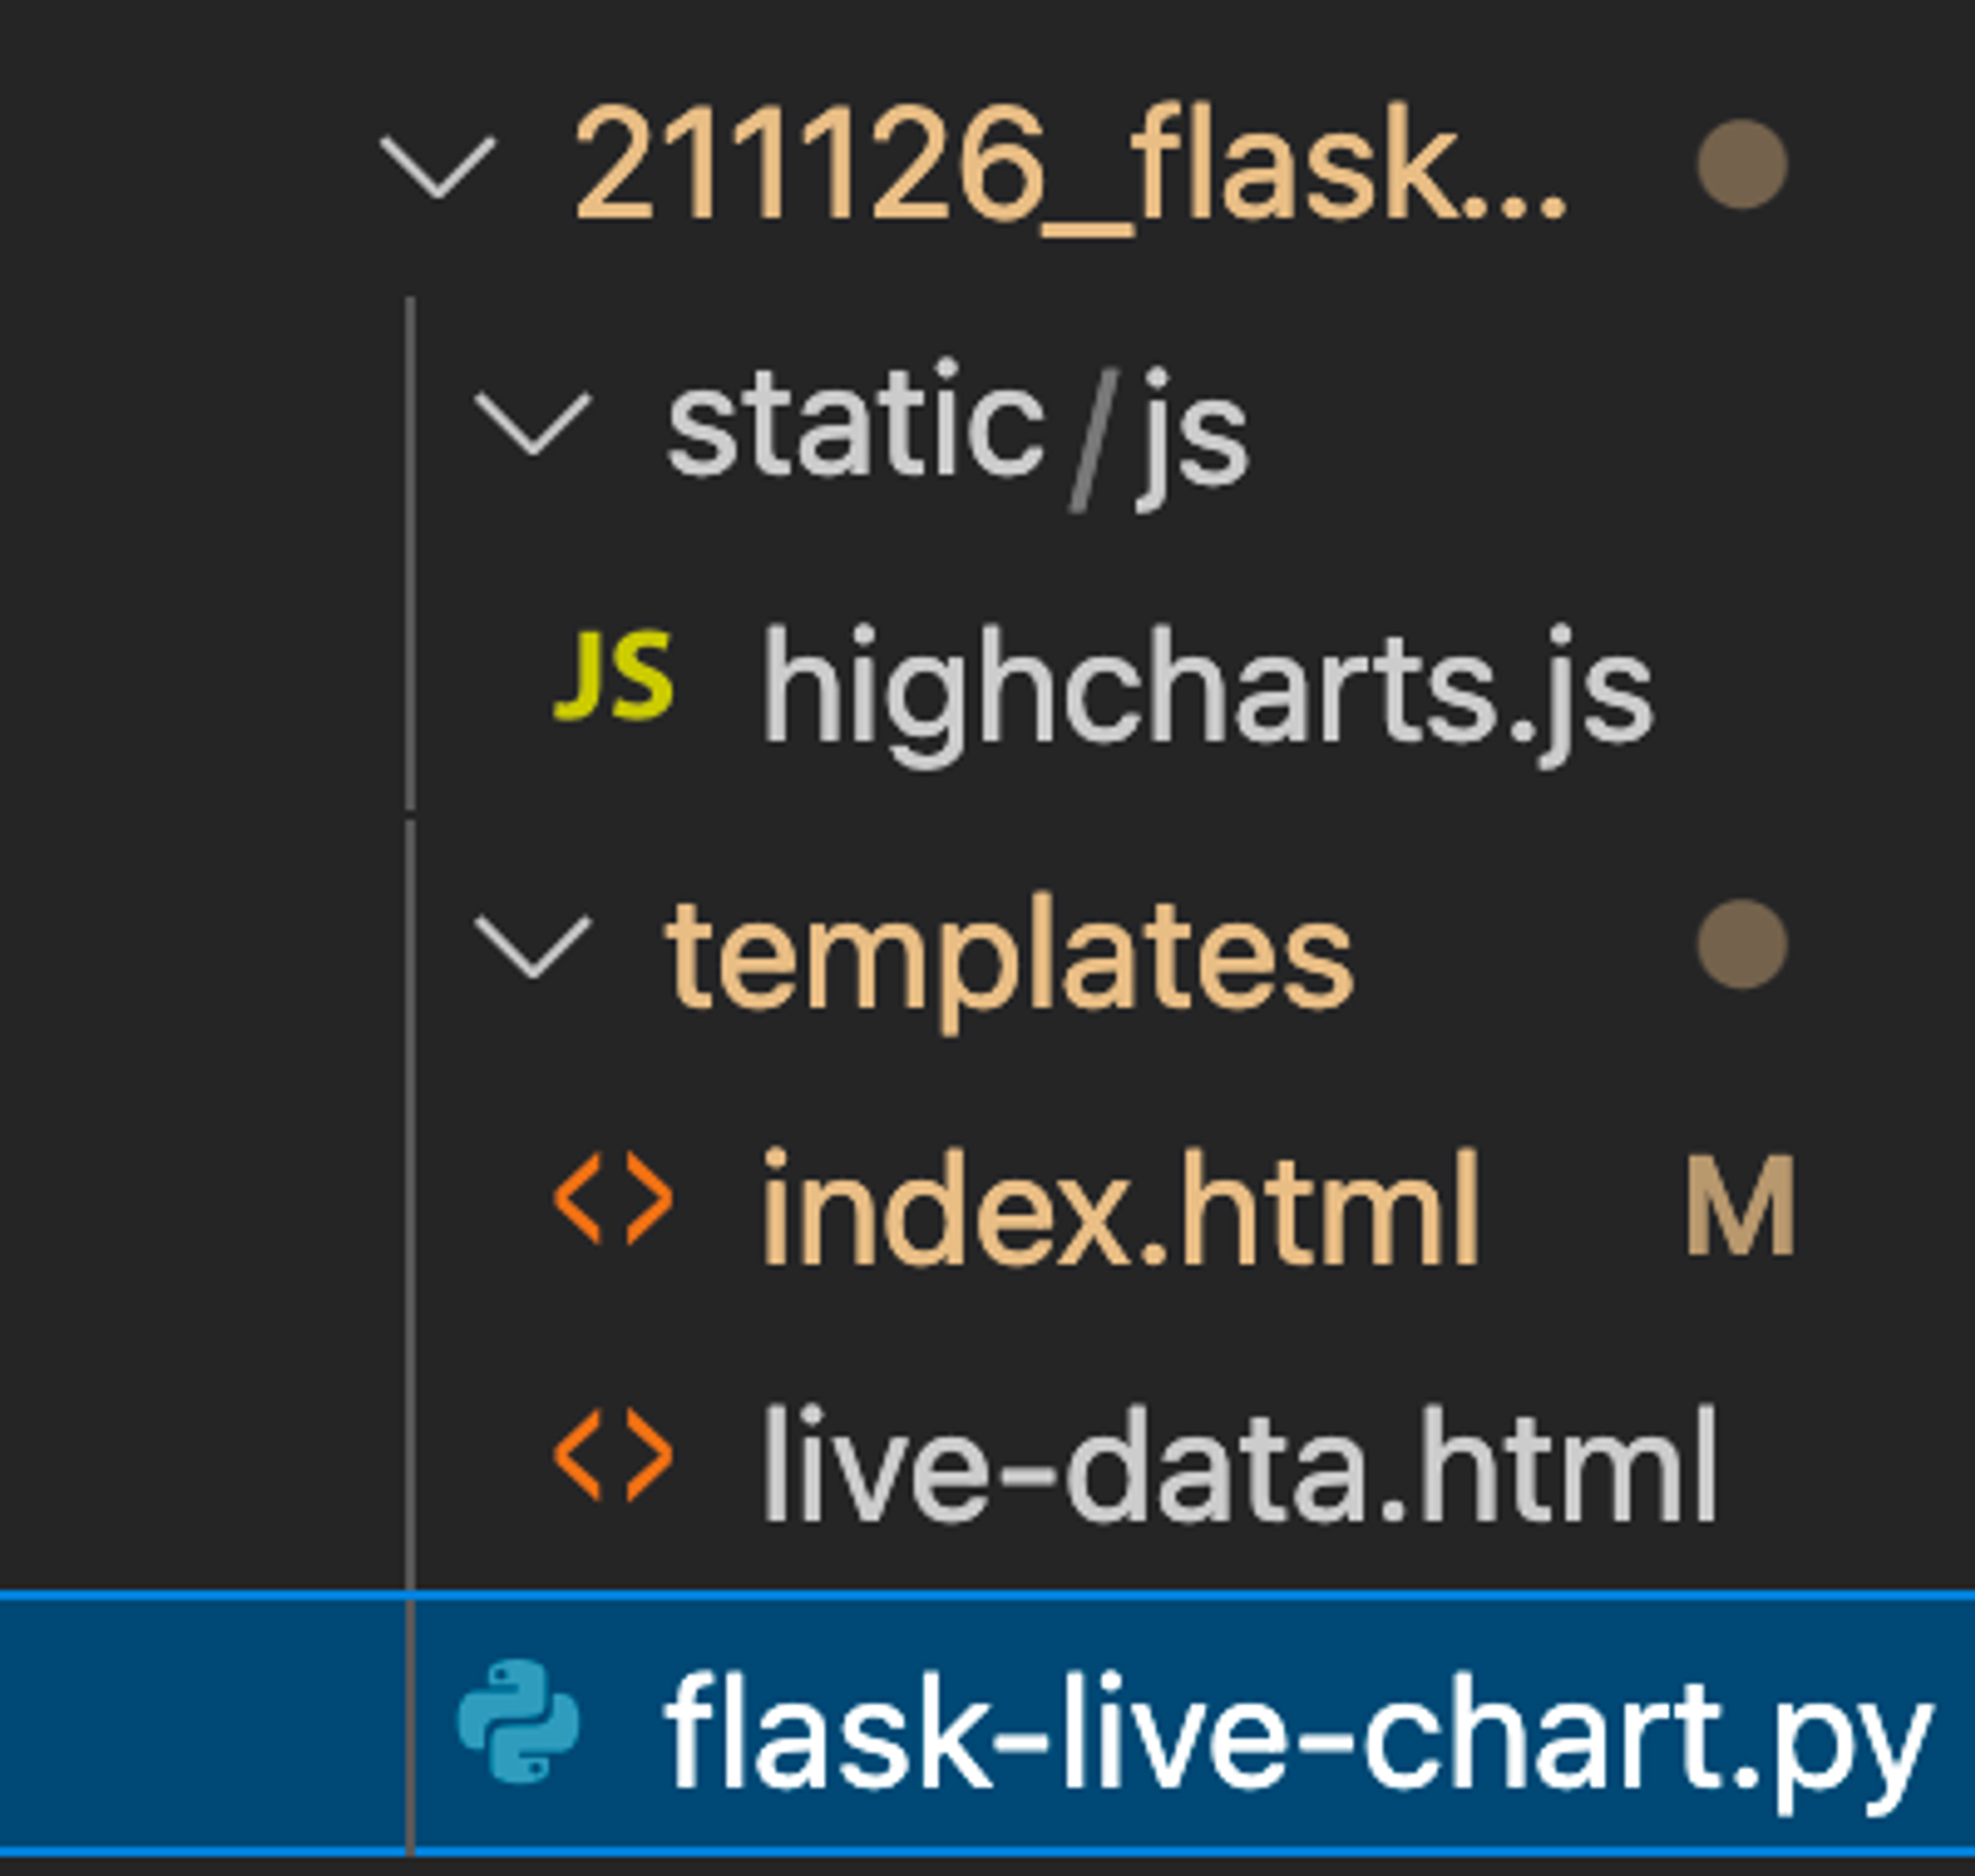
파일구성
•
소스코드
/static/js/hightcharts.js
var chart;
/**
* Request data from the server, add it to the graph and set a timeout
* to request again
*/
function requestData() {
$.ajax({
url: '/live-data',
success: function(point) {
var series = chart.series[0],
shift = series.data.length > 20; // shift if the series is
// longer than 20
// add the point
chart.series[0].addPoint(point, true, shift);
// call it again after one second
setTimeout(requestData, 1000);
},
cache: false
});
}
$(document).ready(function() {
chart = new Highcharts.Chart({
chart: {
renderTo: 'data-container',
defaultSeriesType: 'spline',
events: {
load: requestData
}
},
title: {
text: 'Live random data'
},
xAxis: {
type: 'datetime',
tickPixelInterval: 150,
maxZoom: 20 * 1000
},
yAxis: {
minPadding: 0.2,
maxPadding: 0.2,
title: {
text: 'Value',
margin: 80
}
},
series: [{
name: 'Random data',
data: []
}]
});
});
JavaScript
복사
/templates/index.html
<!DOCTYPE html>
<html lang="en">
<head>
<meta charset="utf-8">
<meta http-equiv="X-UA-Compatible" content="IE=edge">
<meta name="viewport" content="width=device-width, initial-scale=1">
<title>LTOP</title>
<!-- Bootstrap -->
<link rel="stylesheet" href="//maxcdn.bootstrapcdn.com/bootstrap/3.2.0/css/bootstrap.min.css">
<!-- HTML5 Shim and Respond.js IE8 support of HTML5 elements and media queries -->
<!-- WARNING: Respond.js doesn't work if you view the page via file:// -->
<!--[if lt IE 9]>
<script src="https://oss.maxcdn.com/html5shiv/3.7.2/html5shiv.min.js"></script>
<script src="https://oss.maxcdn.com/respond/1.4.2/respond.min.js"></script>
<![endif]-->
</head>
<body>
<div class="navbar navbar-inverse navbar-fixed-top" role="navigation">
<div class="container-fluid">
<div class="navbar-header">
<a class="navbar-brand" href="/">Flask-Live-Chart</a>
</div>
<!-- Collect the nav links, forms, and other content for toggling -->
{# <div class="collapse navbar-collapse" id="bs-example-navbar-collapse-1">#}
{# <ul class="nav navbar-nav">#}
{# <li><a href="#">A link</a></li>#}
{# </ul>#}
{# </div><!-- /.navbar-collapse -->#}
</div>
</div>
<!-- Main jumbotron for a primary marketing message or call to action -->
<div class="jumbotron">
<div class="container-fluid">
<br/>
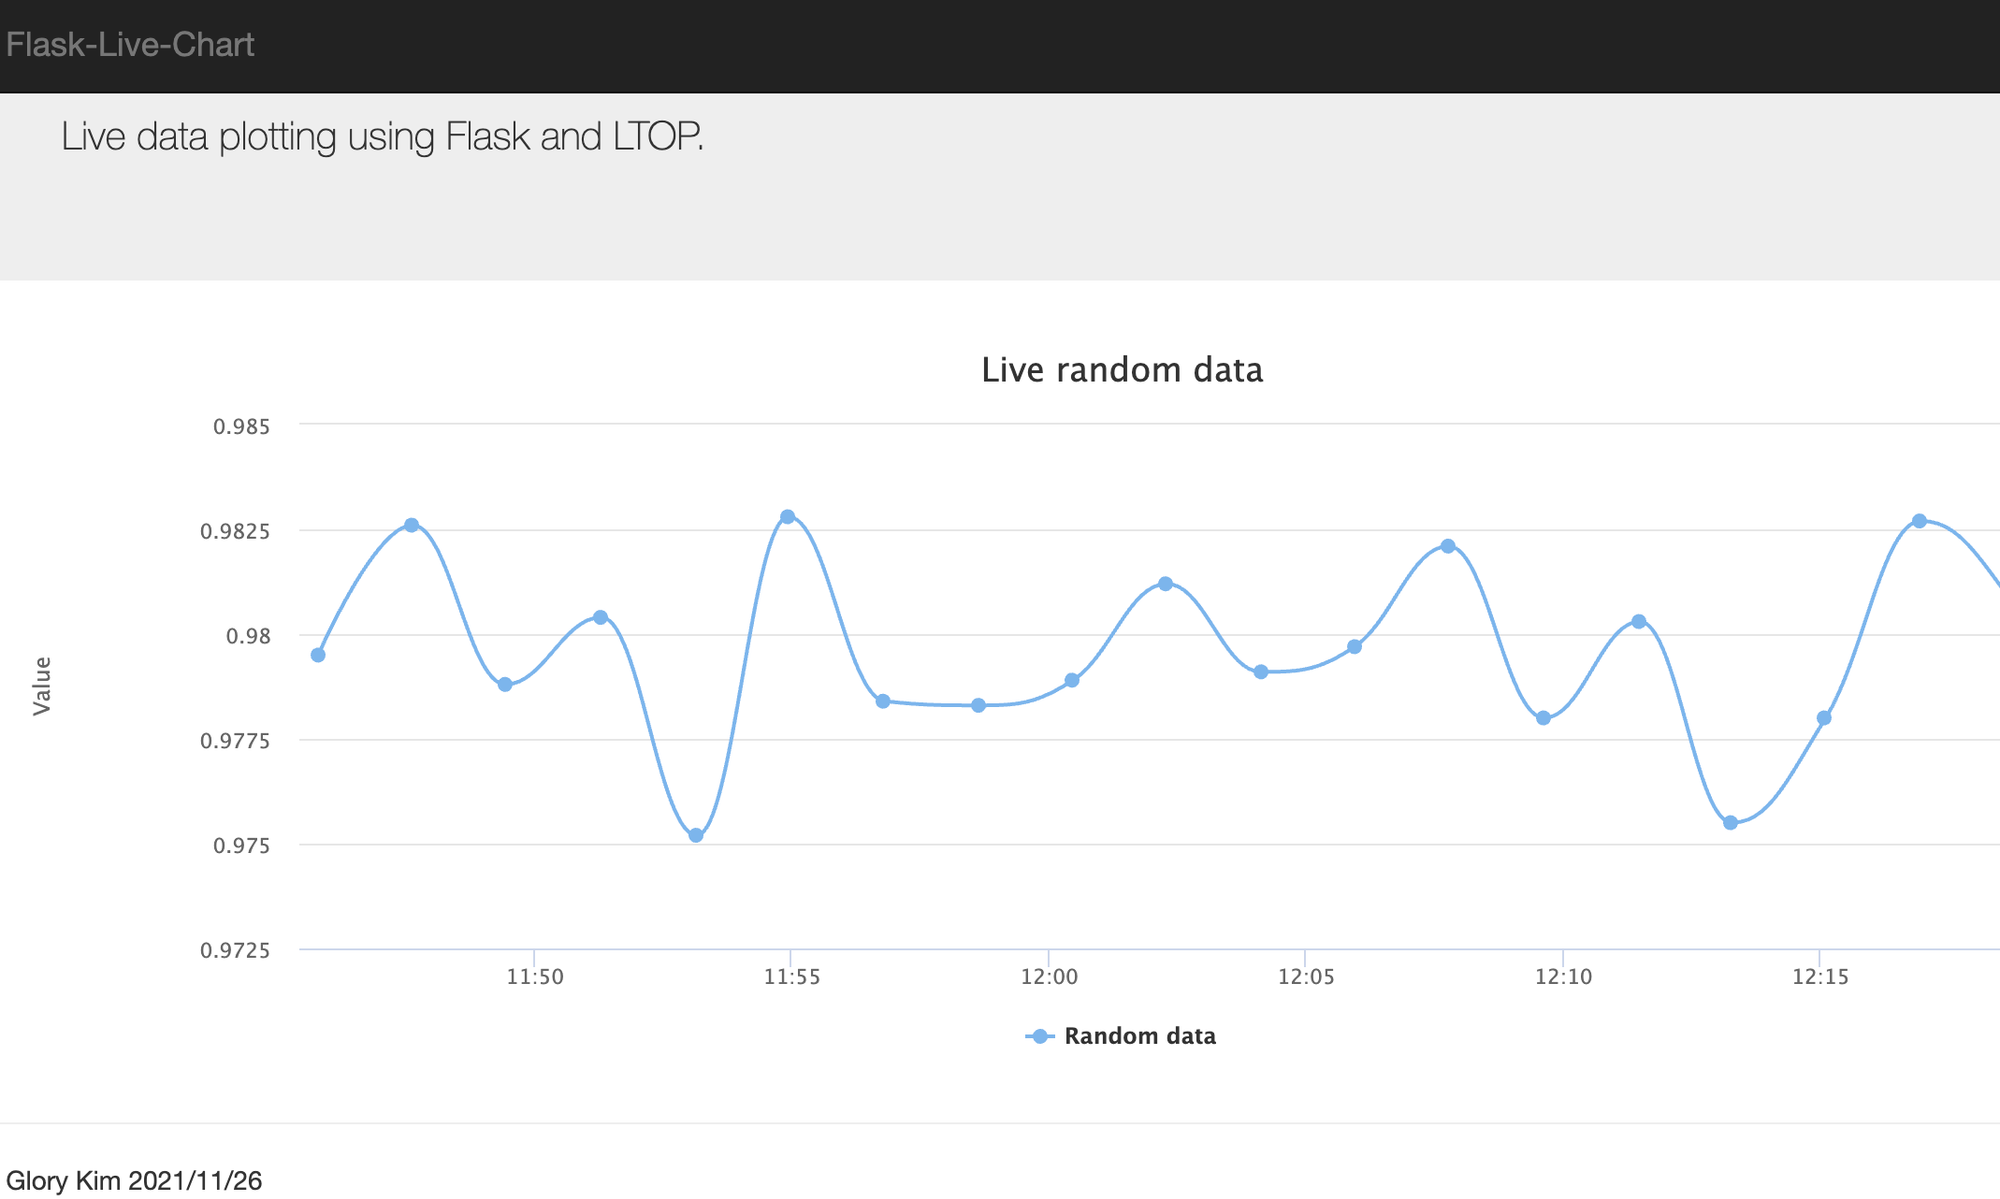
<p>Live data plotting using Flask and LTOP.</p>
</div>
</div>
<div class="container-fluid">
<!-- Example row of columns -->
<div class="row">
<div class="container-fluid" id="data-container"></div>
</div>
</div>
<hr>
<footer>
<p>© Glory Kim 2021/11/26</p>
</footer>
</div> <!-- /container -->
<script src="https://ajax.googleapis.com/ajax/libs/jquery/1.8.3/jquery.min.js"></script>
<script src="http://code.highcharts.com/highcharts.js"></script>
<script src="http://code.highcharts.com/highcharts-more.js"></script>
<script src="http://code.highcharts.com/modules/exporting.js"></script>
<script src="/static/js/highcharts.js"></script>
<!-- Latest compiled and minified JavaScript -->
<script src="//maxcdn.bootstrapcdn.com/bootstrap/3.2.0/js/bootstrap.min.js"></script>
</body>
</html>
HTML
복사
/templates/live-data.html
{{ data }}
HTML
복사
/flask-live-charts.py
import json
from time import time
from random import random
from flask import Flask, render_template, make_response
app = Flask(__name__)
@app.route('/')
def hello_world():
return render_template('index.html', data='test')
@app.route('/live-data')
def live_data():
# Create a PHP array and echo it as JSON
import tensorflow as tf
# 1. MNIST 데이터셋 임포트
mnist = tf.keras.datasets.mnist
(x_train, y_train), (x_test, y_test) = mnist.load_data()
# 2. 데이터 전처리
x_train, x_test = x_train/255.0, x_test/255.0
# 3. 모델 구성
model = tf.keras.models.Sequential([
tf.keras.layers.Flatten(input_shape=(28, 28)),
tf.keras.layers.Dense(512, activation=tf.nn.relu),
tf.keras.layers.Dense(10, activation=tf.nn.softmax)
])
# 4. 모델 컴파일
model.compile(optimizer='adam',
loss='sparse_categorical_crossentropy',
metrics=['accuracy'])
# 5. 모델 훈련
model.fit(x_train, y_train, epochs=5)
# 6. 정확도 평가
test_loss, test_acc = model.evaluate(x_test, y_test)
data = [time() * 10000, test_acc]
response = make_response(json.dumps(data))
response.content_type = 'application/json'
return response
if __name__ == '__main__':
app.run(debug=True, host='127.0.0.1', port=5000)
Python
복사
•
실행명령어 python flask-live-charts.py
•
웹 주소 : http://127.0.0.1:5000/